The idea
There's a public IP camera pointed at a bird feeder in a garden, streaming its feed over MJPEG. I wanted a tiny computer-vision tool that could plug into it and tell me which birds visited and how long they stuck around. Originally no web UI, no cloud, just a single Python script that opens a window with annotated boxes and writes a CSV log on the side.
The whole thing lives in a single main.py file. The gap
between "interesting model" and "useful tool" has gotten very short.
Stack & building blocks
- YOLOv8 (Ultralytics): pre-trained
yolov8s.ptmodel with the COCObirdclass - OpenCV: reading the IP camera's MJPEG stream, drawing overlays, the display window
- CSV as a database: an append-only file that the dashboard later reads back
Anatomy of the script
1. Connecting to the IP camera
The source is the garden camera's public MJPEG stream. OpenCV can open an MJPEG URL directly, but with default settings the remote feed piles up lag and stalls after a few minutes. Three settings fix that: a 1-frame buffer size so it never reads a stale frame, and generous enough open / read timeouts to absorb network latency without crashing.
CAMERA_URL = "http://217.86.173.126/cgi-bin/faststream.jpg?stream=full"

def open_capture():
    cap = cv2.VideoCapture(CAMERA_URL)
    cap.set(cv2.CAP_PROP_BUFFERSIZE, 1)
    cap.set(cv2.CAP_PROP_OPEN_TIMEOUT_MSEC, 5000)
    cap.set(cv2.CAP_PROP_READ_TIMEOUT_MSEC, 10000)
    return cap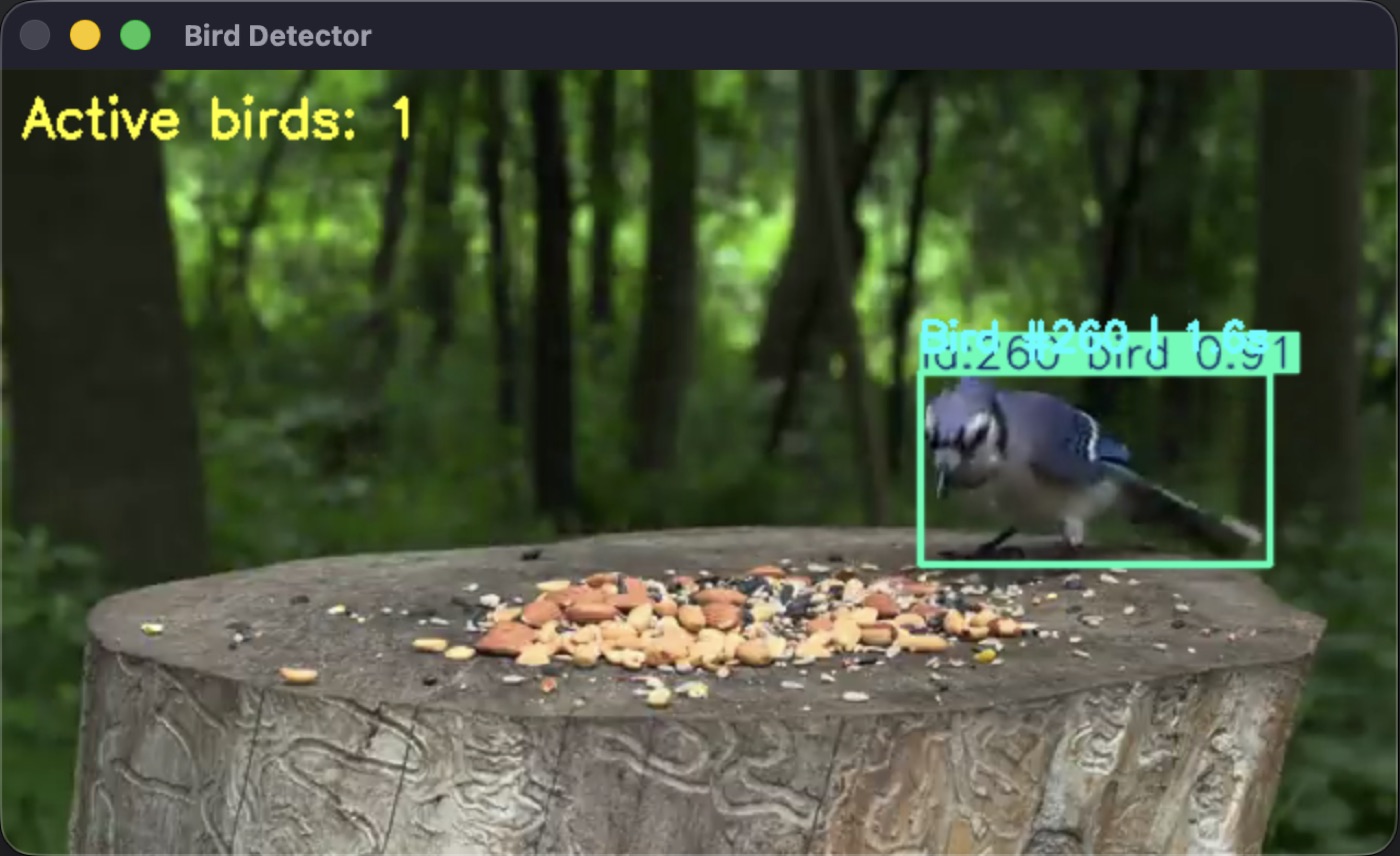
2. Detection with persistent tracking
Each frame is passed through model.track() with
persist=True. This is the key flag: it tells YOLO to keep
track IDs stable across frames, so I can answer the dwell-time
question rather than just "is there a bird right now".
results = model.track(
    frame,
    persist=True,
    verbose=False,
    classes=[bird_class_id],
)[0]
3. Dwell-time bookkeeping
A small active_birds dictionary maps each track ID to a
first-seen and last-seen timestamp. When a bird is detected for the
first time, the script writes a snapshot of the frame to disk (with
a cooldown so it doesn't spam the folder). When it has not been seen
for EXIT_TIMEOUT seconds, the session is closed and a
row is appended to logs/bird_time_log.csv:
track_id,entered_at,left_at,time_spent_seconds
1,2026-05-15_08-14-02,2026-05-15_08-14-31,29.18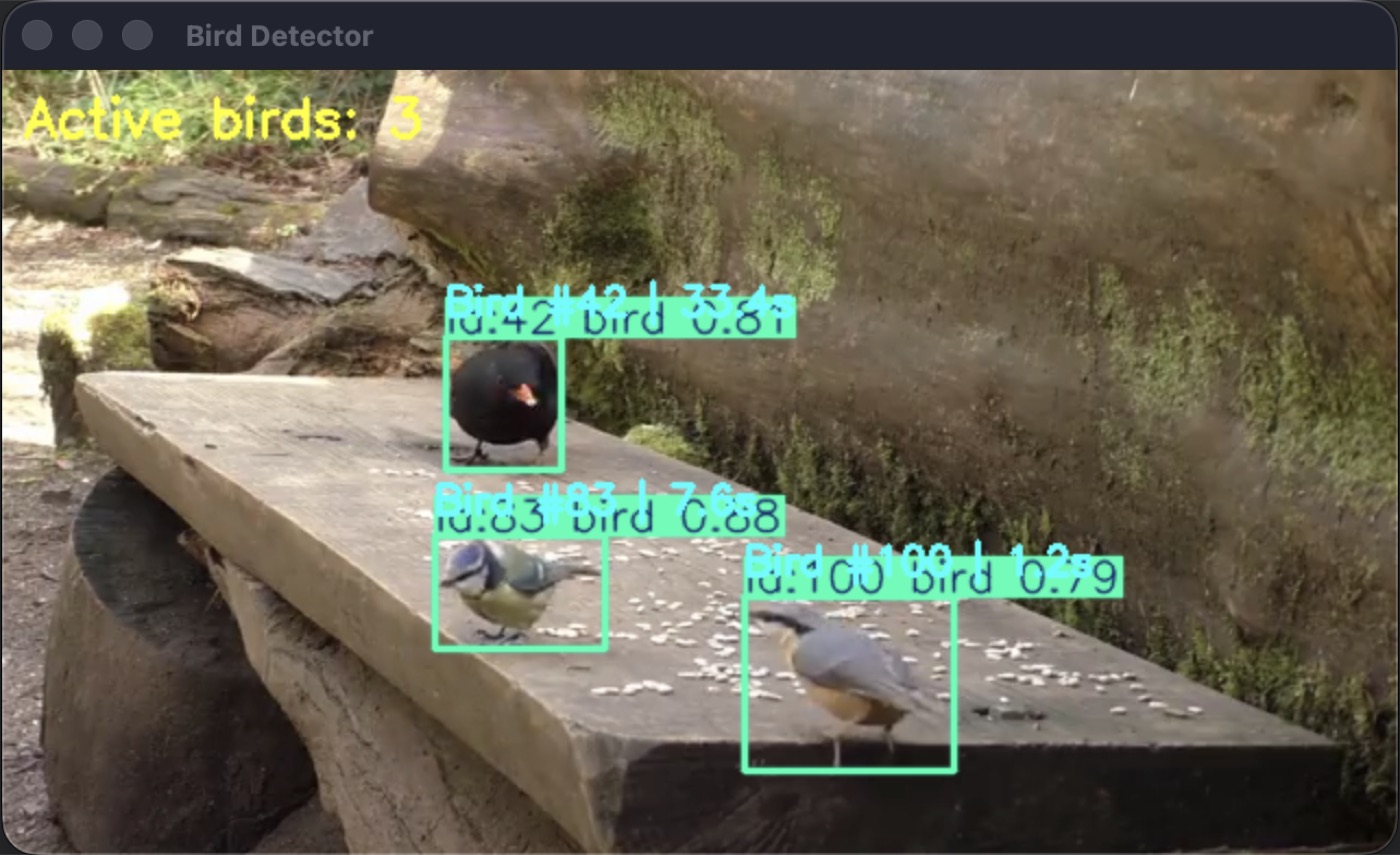
4. A public feed that stays up
The garden camera's MJPEG feed disconnects a lot. The loop tolerates
up to max_read_errors consecutive failed reads, then
releases the capture and reopens it. Simple, but enough to keep this
public feed running for hours without manual intervention.
The dashboard
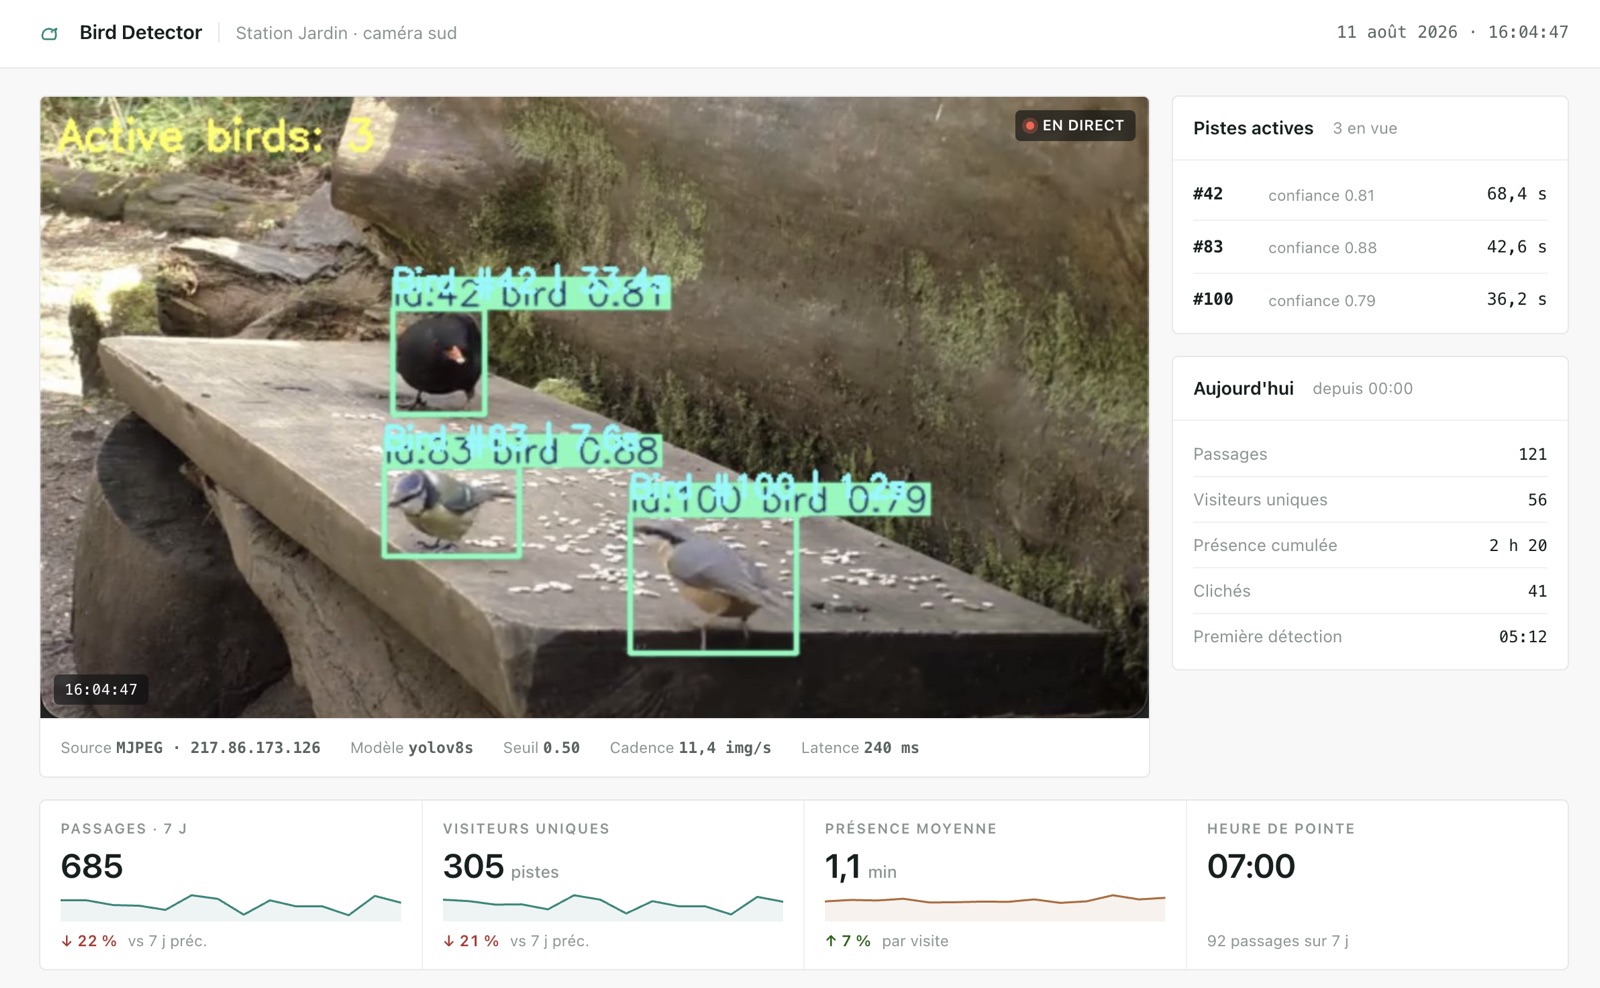
The script ran happily on its own, but a terminal and a CSV file
aren't very shareable. There's now a small dashboard that reads
bird_time_log.csv back to show the live feed next to
the active tracks (ID, confidence, duration), today's stats
(passages, unique visitors, cumulative presence, snapshots) and
7-day trends.
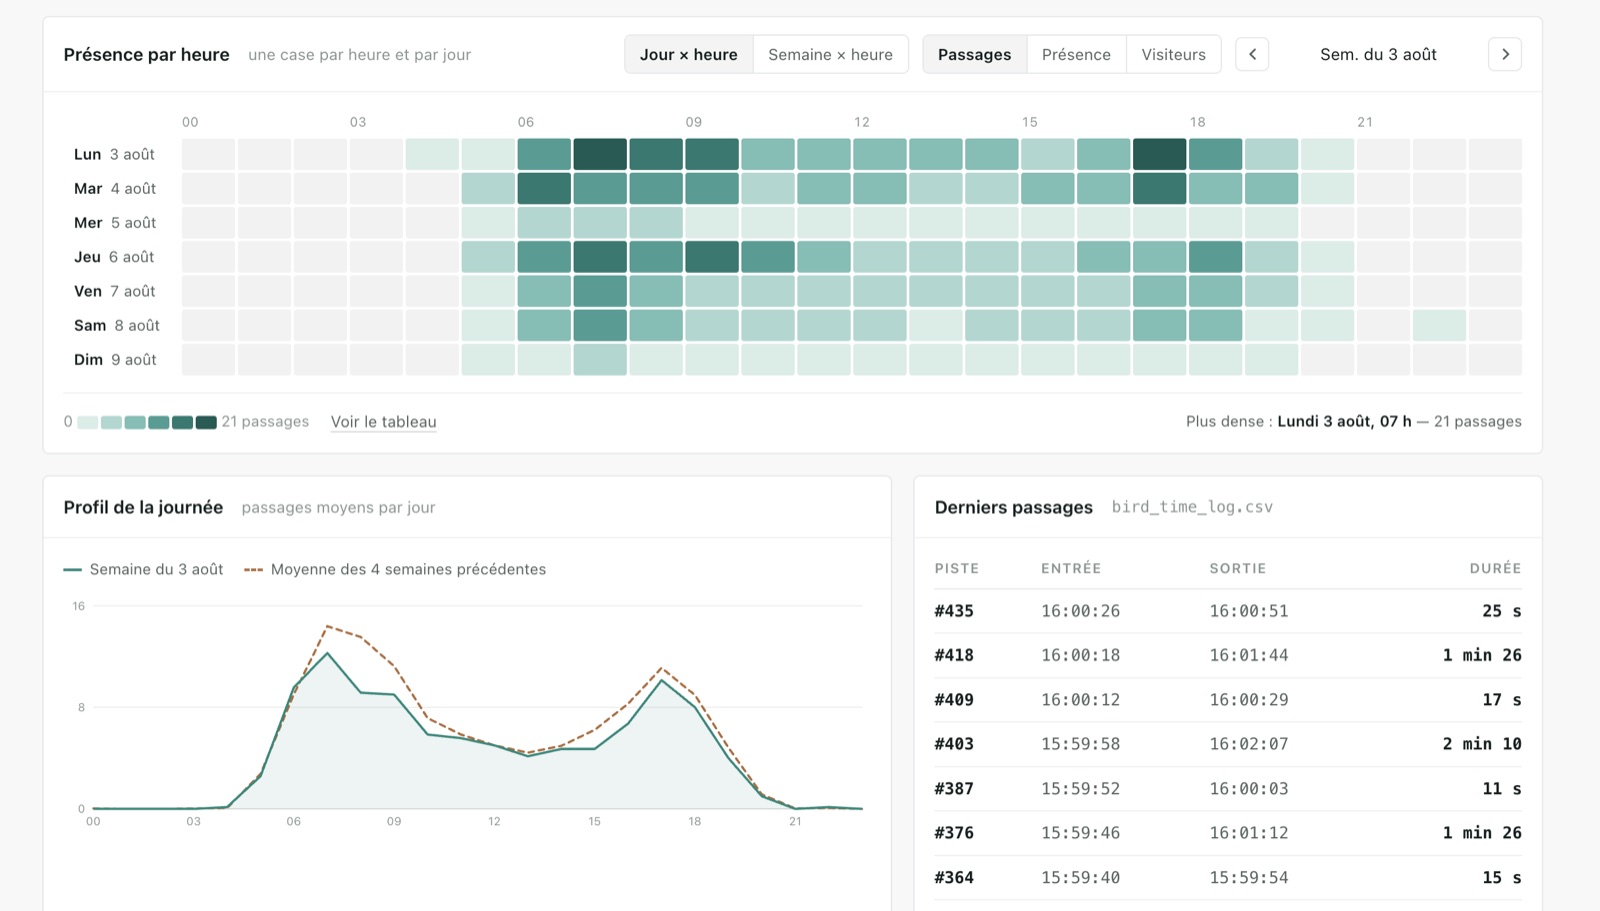
A second view cross-references passages by hour and by day over a rolling week, with the average daily profile and the latest passages streamed straight from the CSV.
What I liked about building this
- The whole pipeline (input → detection → tracking → logging) fits on one screen of Python.
- Ultralytics' tracking is good enough out of the box, no separate tracker library to wire up.
- The CSV log, boring on purpose, turned out to be a perfect base for the dashboard without changing anything on the script side.
- The dashboard makes the project legible to someone who never saw the terminal running.
What's next
Obvious upgrades: species classification on top of detection, alerts when a rare species shows up, and a headless mode for running on a Raspberry Pi pointed at the camera instead of my laptop. The skeleton is already there: most of those changes are 20 to 50 lines.